Note
Go to the end to download the full example code.
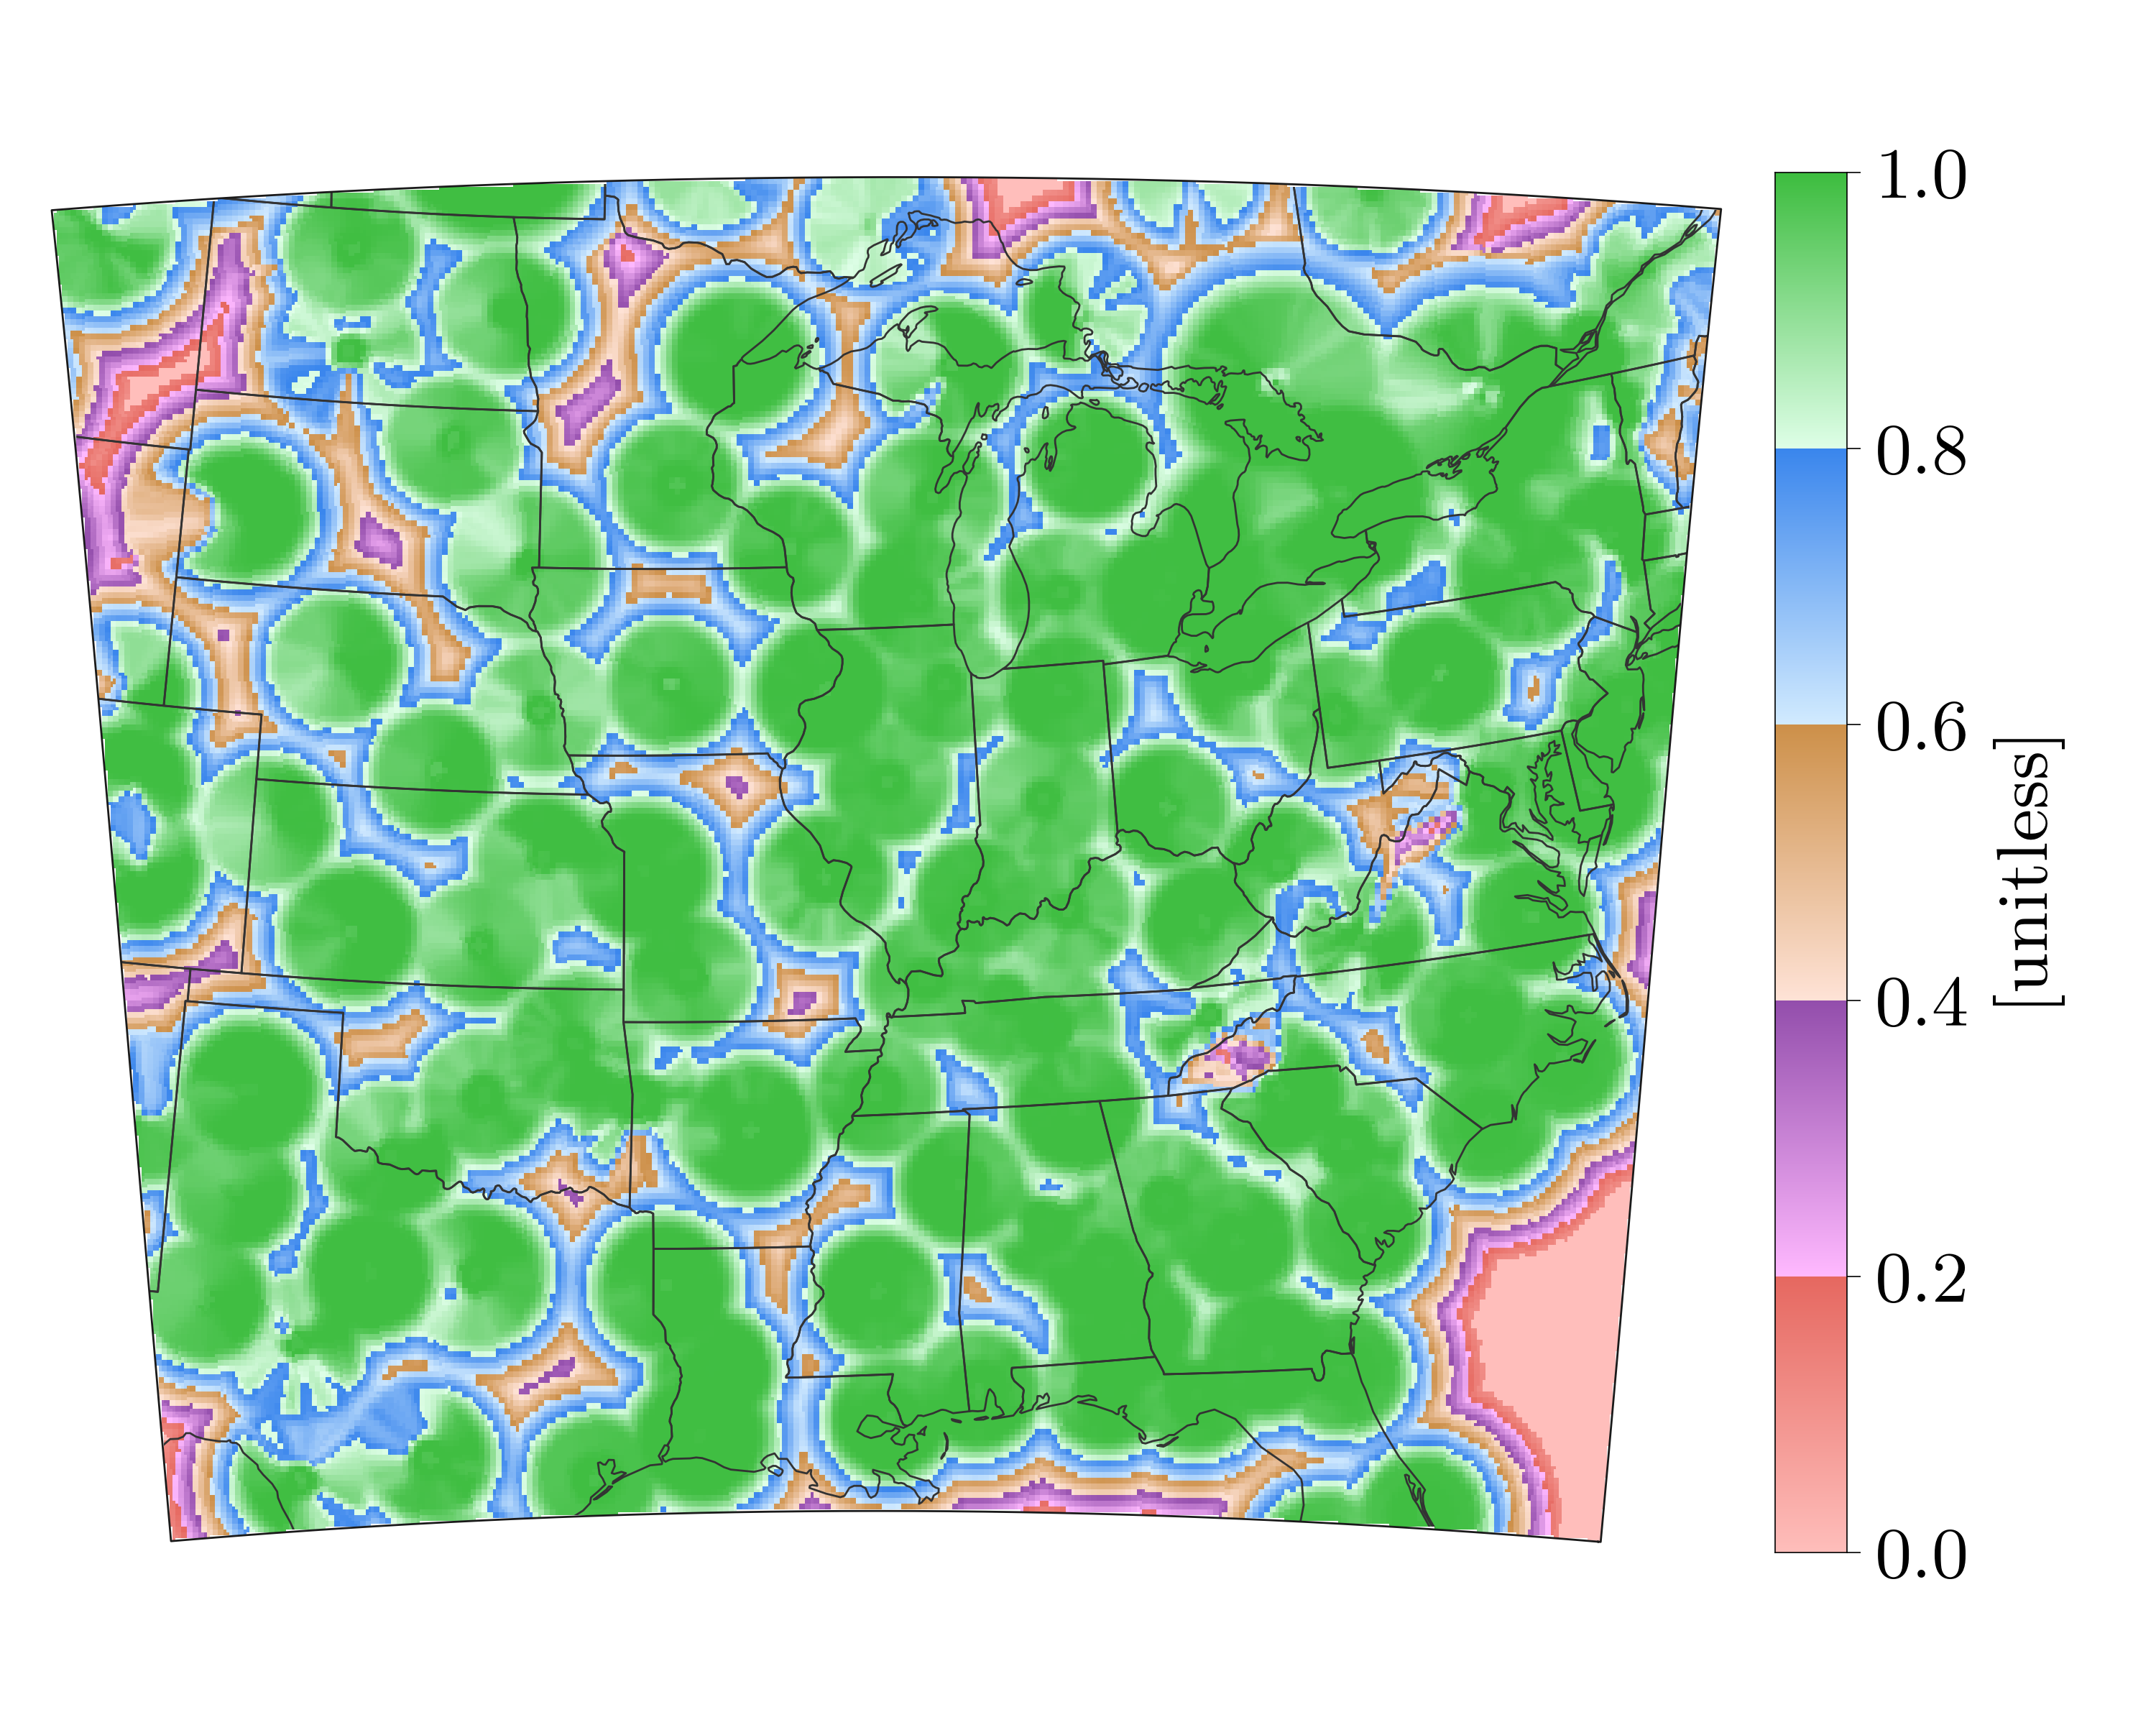
Semi-Continuous Semi-Quantitative
Semi-Continuous color mapping for depiction of a 0-1 quality index
import os, inspect
import pickle
import numpy as np
import matplotlib as mpl
import matplotlib.pyplot as plt
import cartopy.crs as ccrs
import cartopy.feature as cfeature

# In your scripts use something like :
import domutils.geo_tools as geo_tools
import domutils.legs      as legs

def main():
    #recover previously prepared data
    currentdir = os.path.dirname(os.path.abspath(inspect.getfile(inspect.currentframe())))
    parentdir  = os.path.dirname(currentdir) #directory where this package lives
    source_file = parentdir + '/test_data/pal_demo_data.pickle'
    with open(source_file, 'rb') as f:
        data_dict = pickle.load(f)
    longitudes     = data_dict['longitudes']    #2D longitudes [deg]
    latitudes      = data_dict['latitudes']     #2D latitudes  [deg]
    quality_index  = data_dict['qualityIndex']  #2D quality index of a radar mosaic [0-1]; 1 = best quality

    #missing value
    missing = -9999.

    #pixel density of image to plot
    ratio = 0.8
    hpix = 600.       #number of horizontal pixels  E-W
    vpix = ratio*hpix #number of vertical pixels    S-N
    img_res = (int(hpix),int(vpix))

    ##define Albers projection and extend of map
    #Obtained through trial and error for good fit of the mdel grid being plotted
    proj_aea = ccrs.AlbersEqualArea(central_longitude=-94.,
                                    central_latitude=35.,
                                    standard_parallels=(30.,40.))
    map_extent=[-104.8,-75.2,27.8,48.5]

    #point density for figure
    mpl.rcParams['figure.dpi'] = 400
    #larger characters
    mpl.rcParams.update({'font.size': 18})
    mpl.rcParams.update({'font.family':'Latin Modern Roman'})

    #instantiate figure
    fig = plt.figure(figsize=(7.5,6.))

    #instantiate object to handle geographical projection of data
    proj_inds = geo_tools.ProjInds(src_lon=longitudes, src_lat=latitudes,
                                   extent=map_extent,  dest_crs=proj_aea,
                                   image_res=img_res,  missing=missing)

    #axes for this plot
    ax = fig.add_axes([.01,.1,.8,.8], projection=proj_aea)
    ax.set_extent(proj_inds.rotated_extent, crs=proj_aea)

    # Set up colormapping object
    #
    #custom pastel color segments
    pastel = [ [[255,190,187],[230,104, 96]],  #pale/dark red
               [[255,185,255],[147, 78,172]],  #pale/dark purple
               [[255,227,215],[205,144, 73]],  #pale/dark brown
               [[210,235,255],[ 58,134,237]],  #pale/dark blue
               [[223,255,232],[ 61,189, 63]] ] #pale/dark green

    #init color mapping object
    map_qi = legs.PalObj(range_arr=[0., 1.],
                         dark_pos='high',
                         color_arr=pastel,
                         excep_val=[missing],
                         excep_col='grey_120')

    #geographical projection of data into axes space
    proj_data = proj_inds.project_data(quality_index)

    #plot data & palette
    map_qi.plot_data(ax=ax,data=proj_data, zorder=0,
                    palette='right', pal_units='[unitless]', pal_format='{:2.1f}')   #palette options

    #add political boundaries
    ax.add_feature(cfeature.STATES.with_scale('50m'), linewidth=0.5, edgecolor='0.2',zorder=1)

    #plot border and mask everything outside model domain
    proj_inds.plot_border(ax, mask_outside=True, linewidth=.5)

    #plt.show()
    #plt.savefig('example_custom_semi_continuous.svg')

if __name__ == '__main__':
    main()